Efficient Black-Box Prediction of Hydrogen-Bond-Donor and Acceptor Strength
Hydrogen-bond strength is a critical determinant of physicochemical properties and binding affinity in drug discovery, but computationally predicting the strength of different hydrogen-bond donors acceptors remains challenging and inaccessible to non-experts. Here, we report a robust black-box workflow for predicting site-specific hydrogen-bond basicity and acidity in organic molecules with minimal computational cost. Our approach begins with rapid conformer generation and optimization with neural network potentials, followed by a single density-functional-theory calculation of the electrostatic potential. We then calibrate these results against an extensive reference set of experimentally determined pKBHX and pKα, achieving high accuracy in both cases. We illustrate the power of this tool in multiple published drug discovery programs, highlighting how per-site pKBHX tuning can improve bioavailability, minimize efflux, and enhance selectivity.
This preprint can also be viewed on ChemRxiv.
Introduction
Hydrogen bonding is one of the most important non-covalent interactions, and hydrogen bonds frequently comprise key structural elements in biological systems or pharmaceuticals.1–3 In medicinal chemistry, tuning the strength of hydrogen-bond donors and acceptors can modulate P-glycoprotein transport, efflux ratio, lipophilicity, and blood–brain barrier permeability.4–7 For this reason, quantifying the strength of individual hydrogen bonds and understanding how changes to molecular structure affect the strength of individual hydrogen bonds is important in rational molecular design.
Despite the ubiquity of hydrogen bonding in biological systems and medicinal chemistry, the relative strength of different hydrogen-bond donors and acceptors is much less appreciated than other key structural quantities like pKa, bond-dissociation energy, or torsional preferences. Most frequently, the Brønsted acidity or basicity of a given functional group is used as a proxy for its hydrogen-bonding strength. Although this relationship can be valid along a narrow structural series, in general there is "little to no relationship"8 between a molecule's Brønsted acidity and its hydrogen-bond-donor or acceptor characteristics.8–10
The strength of different hydrogen-bond acceptors can be measured experimentally by measuring the association constant with a model hydrogen-bond donor in a given solvent.8–11 Taking the base-10 logarithm of this association constant gives pKBHX, the strength of the hydrogen-bond acceptor. While pKBHX values can be measured for any combination of hydrogen-bond donor, hydrogen-bond acceptor, and solvent, for "a mixture of historical and technical reasons" (Laurence et al.11) 4-fluorophenol is typically used as the hydrogen-bond donor and carbon tetrachloride is typically used as the solvent. Hydrogen-bond-acceptor strengths measured under these conditions correlate with pKBHX values measured with other hydrogen-bond donors or in different solvents, although exceptions exist: for instance, pKBHX values measured with 4-fluorophenol are poorly predictive for C–H hydrogen-bond donors.11
Here, we follow precedent & existing datasets and consider only pKBHX values measured with 4-fluorophenol in carbon tetrachloride. These pKBHX values typically vary between about −1 and 5—weak hydrogen-bond acceptors like alkenes have a pKBHX value between −1 and 0, while strong hydrogen-bond acceptors like amides have pKBHX values between 2 and 2.5, and only very strong hydrogen-bond acceptors like N-oxides have pKBHX values greater than 3 (Figure 1).
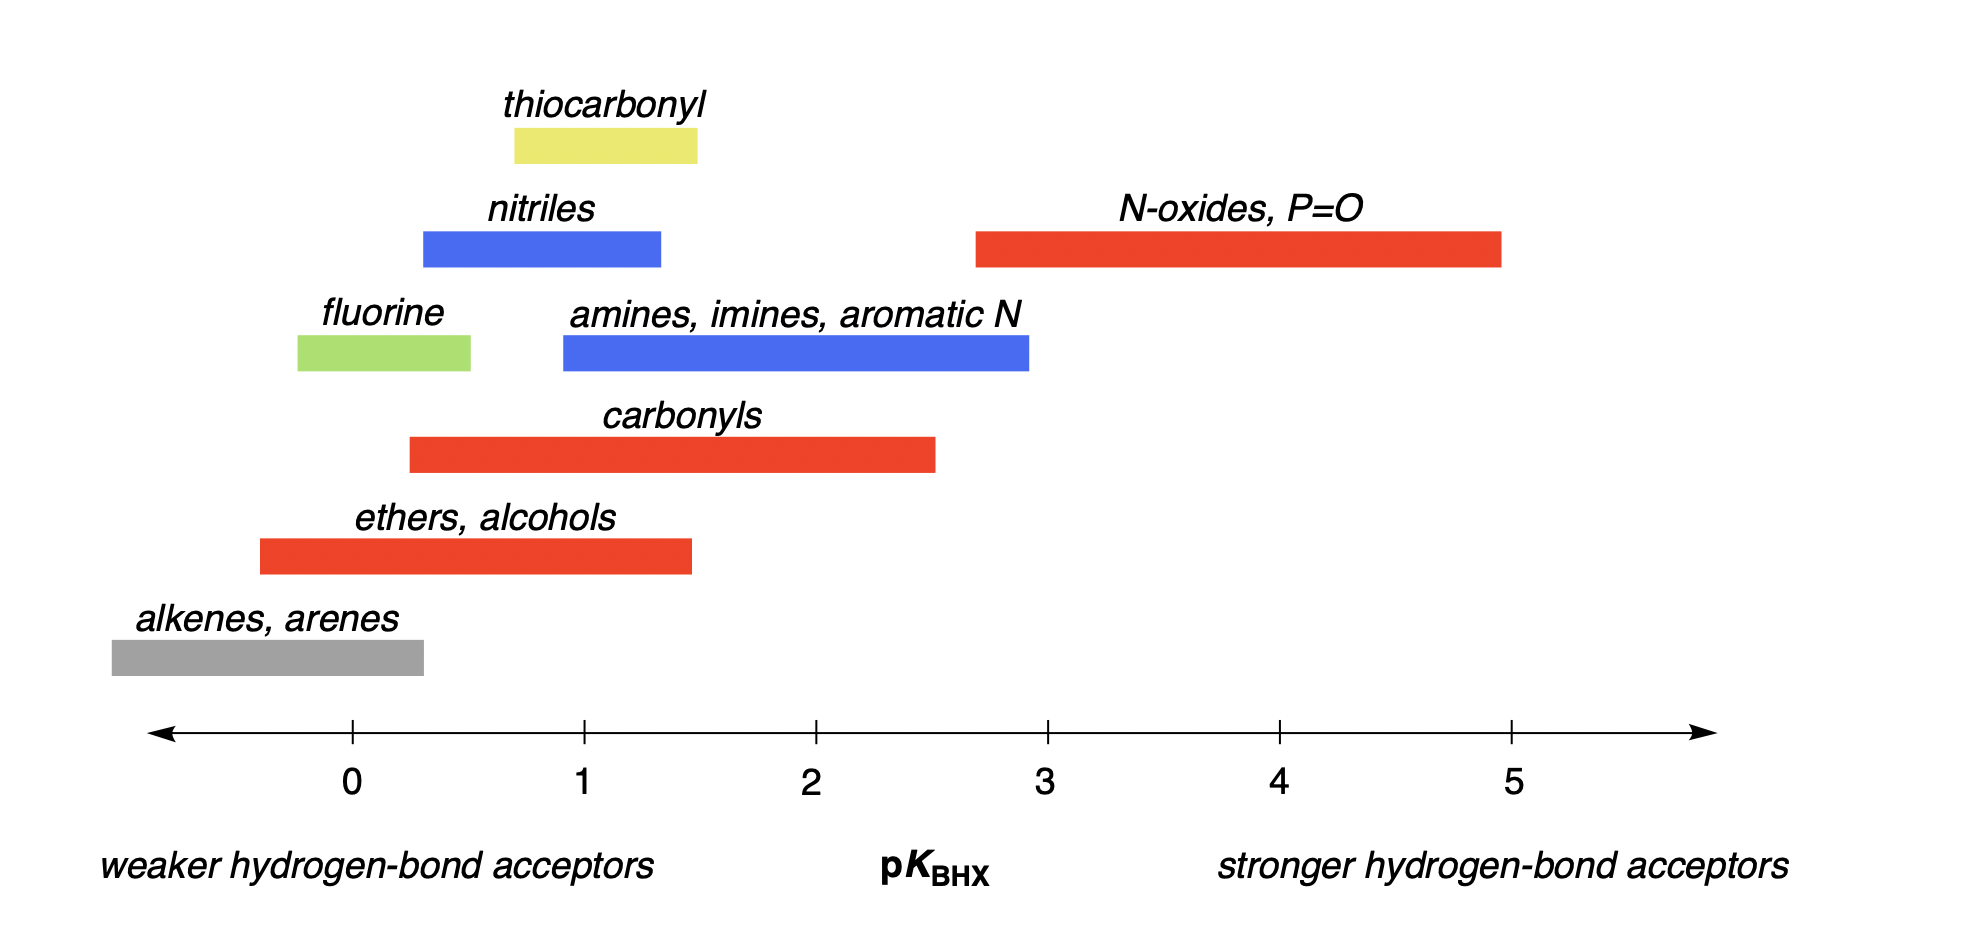
Figure 1: Archetypal pKBHX values for various functional groups; this figure depicts only general trends, and exceptions exist in all cases. pKBHX values were measured using 4-fluorophenol as the hydrogen-bond donor and carbon tetrachloride as the solvent.
While hundreds of pKBHX values have been experimentally measured under these conditions over the past three decades,11,12 there is still a need to compute hydrogen-bond-acceptor strength for new organic compounds. Experimental pKBHX measurements produce a single measure of hydrogen-bond-acceptor strength for the entire molecule, while rational design of functional molecules typically requires atom-level quantification of hydrogen-bond basicity. The strength of different hydrogen-bond acceptors is quite sensitive to the electronic properties of the acceptor, making it crucial to correctly account for the specific substitution of the molecule in question. For this reason, the efficient and accurate prediction of hydrogen-bond basicity has been a topic of active research in computational chemistry for decades.6,13–21
Since the 1990s, researchers have found that the minimum electrostatic potential in the region of lone pairs (Figure 2) can be used to predict the strength of various hydrogen-bond acceptors, with different scaling parameters employed for each functional group.6,13,22,23 Nevertheless, the computational cost and complexity of these workflows has limited their broader adoption in rational molecular optimization. Here, we report an efficient workflow for the -based automated prediction of hydrogen-bond basicity for unseen organic molecules. Rowan's pKBHX prediction workflow uses neural network potentials to accelerate geometry optimization, requires only a single low-cost DFT calculation per molecule, and gives high-accuracy results across a wide set of structurally varied molecules and medicinally relevant scaffolds. We illustrate the utility of these predictions with a variety of case studies drawn from the medicinal chemistry literature, and show that this same strategy can be applied to the prediction of hydrogen-bond-donor strength.
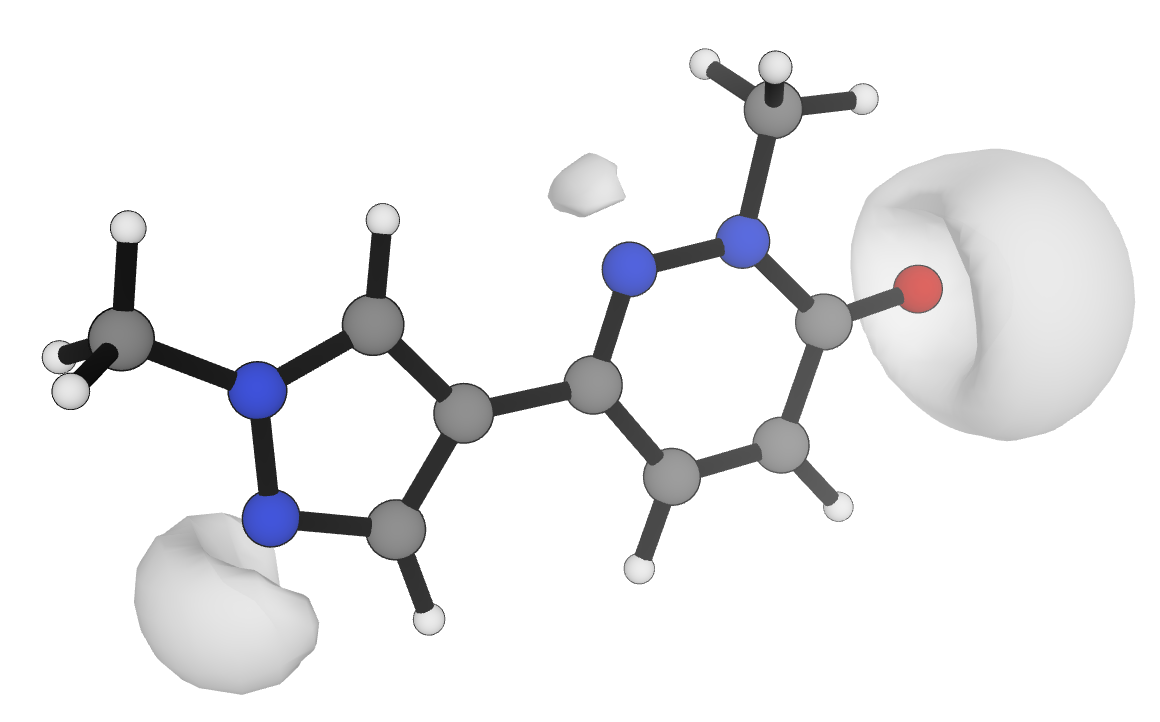
Figure 2: Visualization of the −0.04 electrostatic potential isosurface at the r2SCAN-3c level of theory24 for a multifunctional druglike molecule in Rowan.25 Values of are obtained by numerical minimization within the regions illustrated.
Results and Discussion
Rowan's hydrogen-bond-basicity workflow begins by running a conformer search on the input molecule using the ETKDG algorithm as implemented in RDKit.26–28 Following initial conformer generation and MMFF94 optimization,29 we filter the resulting conformational ensemble using the CREST screening protocol and GFN2-xTB energies to de-duplicate structures and remove high-energy conformers.30,31 A 2% rotational constant threshold, a 0.25 Å RMSD similarity threshold, and a 50 kcal/mol energy cutoff window are employed for CREST screening.
We score & optimize the output conformers with the AIMNet2 neural network potential32 and use the lowest energy conformer for subsequent calculations. Following Peter Kenny, we predict the basicity of each hydrogen-bond acceptor by computing around the hydrogen-bond-accepting atom (using the low-cost "Swiss-army knife" r2SCAN-3c method)24 and linearly scaling these potentials to match experimental pKBHX values.6 Electrostatic potential minima were located by numerical minimization of the electrostatic potential (computed via the ESPPropCalc object in Psi4)33 with the BFGS algorithm in Scipy.34
All density-functional-theory computations were conducted with Psi4 1.9.1.33 (The default settings in Psi4 were modified somewhat: a (99,590) integration grid with "robust" pruning, the Stratmann–Scuseria–Frisch quadrature scheme was employed,35 and an integral tolerance of 10−14 was used throughout.36) Density fitting was employed for all calculations and a level shift of 0.10 Hartree was applied to accelerate SCF convergence.37 AIMNet2 geometry optimizations were run using geomeTRIC 1.0.2.38
To find values for the scaling constants, we employed Kenny's 2020 database of experimentally measured pKBHX values,12 and predicted the measured per-molecule pKBHX values by combining the predicted pKBHX values from each distinct electrostatic potential minimum (up to three per hydrogen-bond acceptor, following Equation 3 from Kenny et al.6). A total of 434 molecules were employed after excluding those for which 3D conformations could not be generated using ETKDG. We used Levenberg–Marquardt least-squares fitting39,40 as implemented in LMFIT41 to solve the resulting non-linear optimization problem.
| Functional Group | Number | Slope () | Intercept | MAE | RMSE |
|---|---|---|---|---|---|
| Amine | 171 | -34.4386 | -1.4884 | 0.212 | 0.324 |
| Aromatic N | 71 | -52.8126 | -3.1376 | 0.113 | 0.150 |
| Imine | 28 | -48.4007 | -2.3309 | 0.180 | 0.236 |
| Nitrile | 28 | -50.1167 | -3.2273 | 0.144 | 0.198 |
| N-oxide | 16 | -74.3261 | -4.4159 | 0.455 | 0.589 |
| Chalcogen oxide | 17 | -47.7009 | -2.2794 | 0.186 | 0.224 |
| Pnictogen oxide | 16 | -61.1141 | -3.3839 | 0.437 | 0.549 |
| Carbonyl | 128 | -57.2911 | -3.5271 | 0.160 | 0.208 |
| Ether/hydroxyl | 99 | -35.9245 | -2.0338 | 0.188 | 0.239 |
| Thiocarbonyl | 10 | -51.8837 | -2.2649 | 0.330 | 0.384 |
| Divalent S | 17 | -39.1666 | -2.1243 | 0.086 | 0.127 |
| Aromatic O | 11 | -35.9245 | -2.0338 | 0.125 | 0.158 |
| Fluorine | 23 | -16.4441 | -1.2540 | 0.202 | 0.276 |
| Total | 434 | 0.188 | 0.270 |
Table 1: Summary of number of data points, scaling slope, scaling intercept, mean absolute error (MAE), and root mean squared error (RMSE) for each functional group.
Our final workflow gives a mean error of approximately 0.19 pKBHX units (Table 1), comparable to previously reported methods.6,42 Most of the outliers are bulky amines (Figure 3): electrostatic potential–based predictions seem to overestimate the basicity of these sites, since bulky groups will block the approach of hydrogen-bond donors like 4-fluorophenol while minimally perturbing the electrostatic potential of the lone pair. For instance, triisopropylamine has a predicted pKBHX value of 1.39 units, but an experimental pKBHX value of 0.30 units, likely due to the bulky substituents preventing access to the central nitrogen.
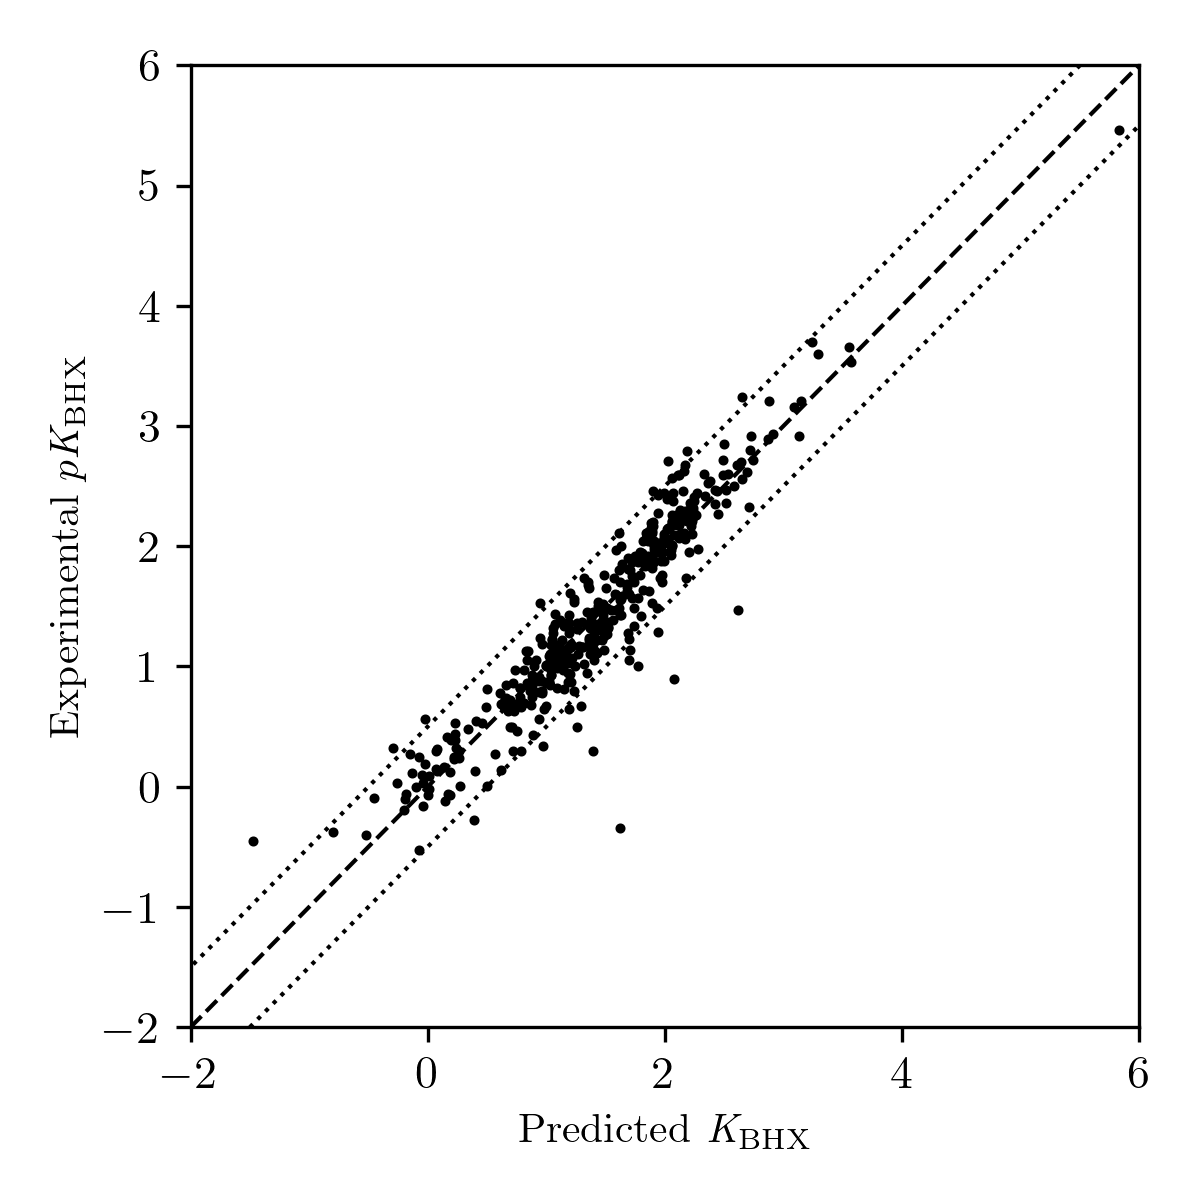
Figure 3: Plot of predicted vs. experimental pKBHX values for compounds in Kenny's 2020 pKBHX database.12 Dotted lines indicate errors of ±0.5 pKBHX units.
This sequence of steps avoids time-consuming geometry optimizations at the DFT level of theory, instead using the AIMNet2 neural network potential to optimize structures and running a single low-cost r2SCAN-3c calculation on the final minimum. Predictions can be run for the entire dataset above in a few hours on a conventional laptop, and even 50-atom systems run in fewer than 10 minutes. The above hydrogen-bond-acceptor-strength-prediction workflow has been implemented in the Rowan cloud computational-chemistry platform,25 making it simple to submit calculations and quickly visualize the relative strength and position of different hydrogen-bond acceptors (Figure 4).
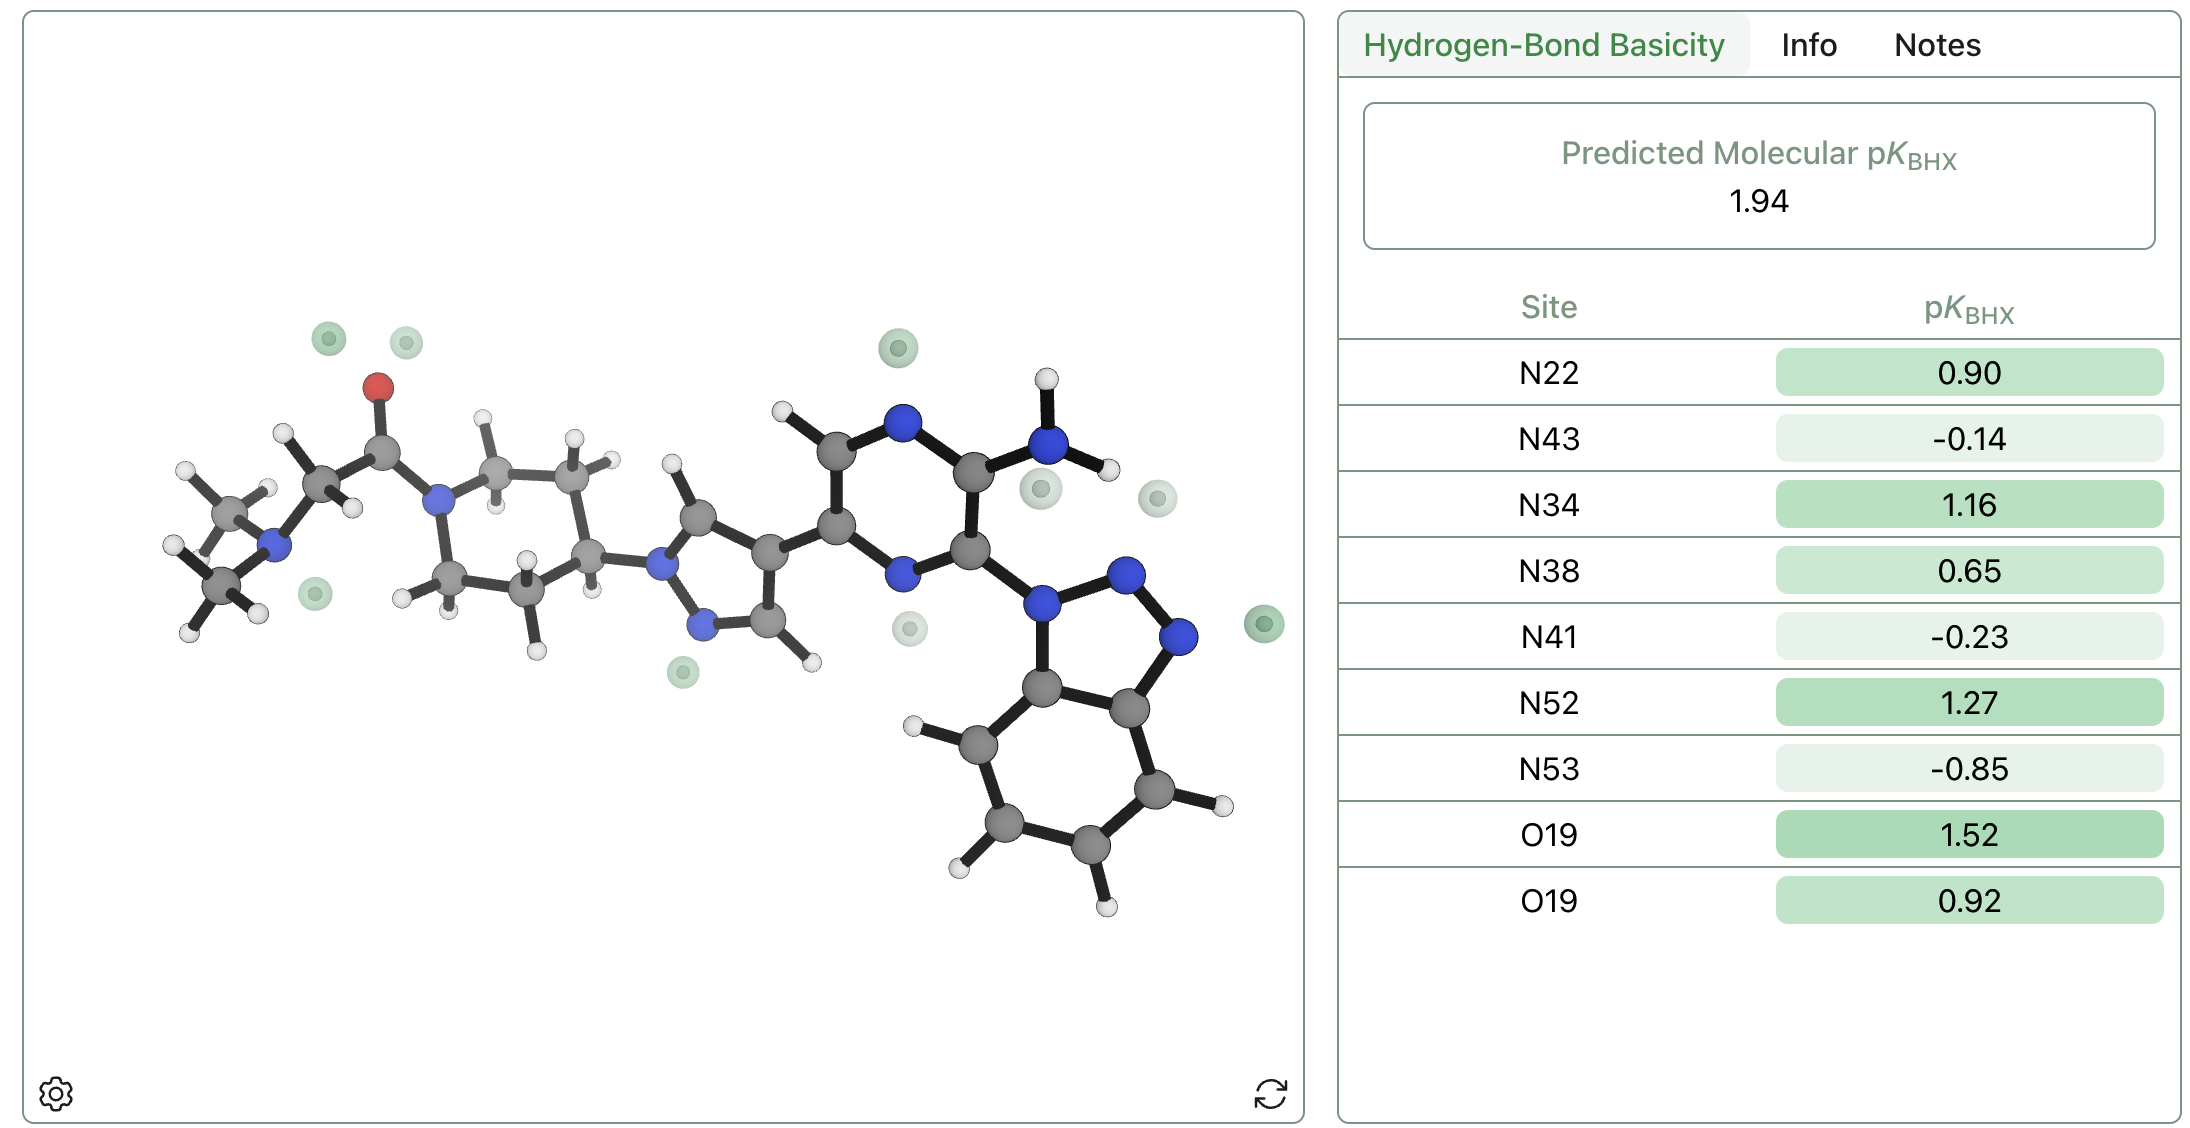
Figure 4: Visualization of predicted pKBHX sites and values for an example small molecule through the Rowan platform.25
Hydrogen-Bond Acidity
We next investigated whether the above workflow could be modified to simultaneously predict hydrogen-bond acidity (pKα). Hydrogen-bond-donor sites have no such associated extrema on the electrostatic-potential surface, making naïve extension of the above -based strategy to hydrogen-bond donors impossible. However, previous work by Peter Kenny showed that the electrostatic potential at a fixed distance from the donor hydrogen atom could be linearly scaled to match experimental hydrogen-bond-donor-strength values, prompting us to investigate including this approach within our existing workflow.23
Following Kenny, we compute the characteristic electrostatic potential Vα for a given hydrogen-bond-donor motif X–H at a point 0.55 Å past the hydrogen along the bond axis, following precedent from Kenny.23 This electrostatic potential is converted to a per-donor hydrogen-bond-acidity value through linear scaling, and per-donor hydrogen-bond acidities are combined into a single per-molecule hydrogen-bond-acidity value that can be compared to experimental pKα values.
The above protocol has only two tunable parameters: the slope m and intercept b used to scale Vα. To obtain values for these parameters, we employed Kenny's dataset of 41 association constants between hydrogen-bond donors and N-methylpyrrolidone in 1,1,1-trichloroethane. Levenberg–Marquardt least-squares fitting39,40 yielded values of 42.18 for m and -12.46 for b, in rough agreement with constants obtained by Kenny,23 and a good fit to experimental data (Figure 5).
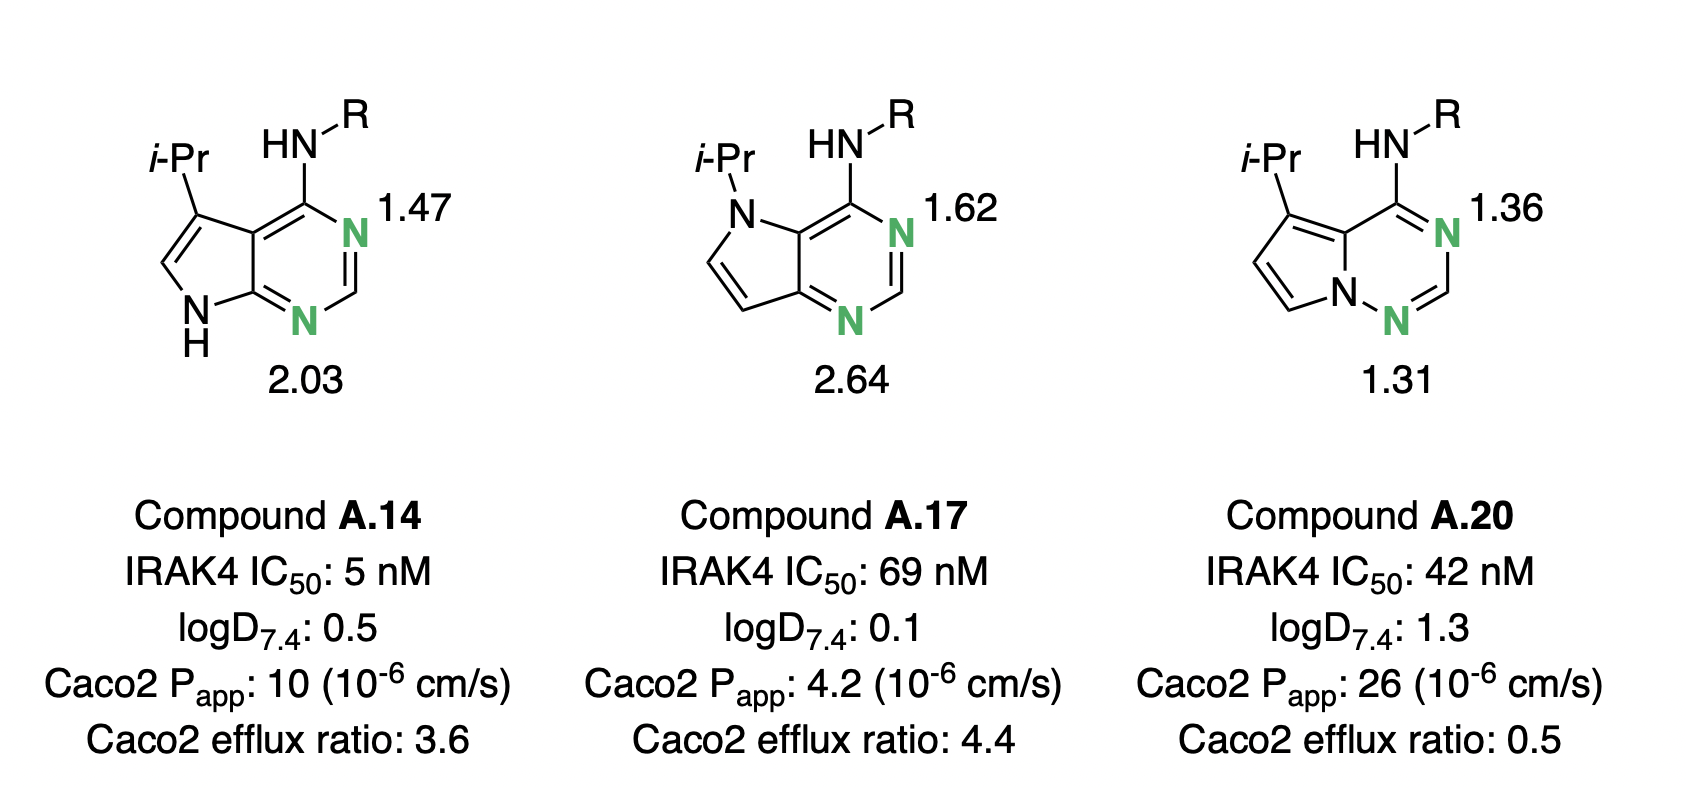
Figure 5: Plot of predicted vs. experimental pKα values for compounds in Kenny's 2009 pKα database.23 Dotted lines indicate errors of ±0.5 pKα units.
Case Studies
Here, we demonstrate how hydrogen-bond-basicity and acidity prediction can be used to gain chemical insight and motivate the design of molecules with better potency or biophysical properties. The original compound numbers from each paper have been kept for easy reference back to the original publication, with a prefix added for disambiguation.
The below discussion assumes some familiarity with terminology from medicinal chemistry. Briefly: medicinal chemists commonly rely on parameters such as IC50, EC50, logD7.4, permeability, and efflux ratio to guide the optimization of pharmacokinetic and pharmacodynamic properties.43 The IC50 value quantifies the concentration of a compound needed for half-maximal inhibition of a specific enzyme or pathway, while the EC50 is the concentration at which half the maximal effect (e.g., in a cellular or functional assay) is observed—lower values of either indicate higher potency or efficacy. LogD is the distribution coefficient (often measured at a specific pH, such as 7.4) between n-octanol and water: higher values indicate that a compound is more lipophilic, while lower values indicate that a compound is more hydrophilic.43
The efflux ratio, often measured in polarized cell monolayer assays such as the human Caco-2 cell line, captures how readily a compound is transported out of cells. In such assays, the apparent permeability from the apical to basolateral side () is compared to the permeability in the reverse direction ().43 A high efflux ratio suggests active pumping by transporters like P-glycoprotein (P-gp), an ATP-dependent efflux transporter. Mean residence time refers to the average time a drug molecule remains in the body—from the moment it enters circulation until it is completely eliminated—providing a useful measure of how long the compound stays available for therapeutic effect. In most drug discovery campaigns, scientists aim to increase permeability and decrease efflux while maintaining high on-target potency.43
A: Lowering Efflux Ratio In IRAK4 Inhibitors
In 2018, Sébastien Degorce and co-workers embarked on a campaign to optimize the biophysical properties of IRAK4 inhibitors, with the goal of identifying potent and orally bioavailable inhibitors as potential treatments for diffuse large B-cell lymphoma.44 As a part of this effort, scaffold hopping between different pyrrolopyrimidine and pyrrolotriazine cores was investigated, with the goal of increasing lipophilicity and lowering the hydrogen-bond basicity of the scaffold. The authors found that moving from the original pyrrolopyrimidine scaffold (exemplified by A.14) to an isomeric pyrrolopyrimidine (A.17) decreased permeability and lipophilicity, despite removing one hydrogen-bond donor (Figure 6).
We investigated these systems with the -based pKBHX workflow described above, and found that the pyrimidine ring in A.17 was predicted to show significantly increased hydrogen-bond basicity. The basicity of the pyrimidine increased by pKBHX units, thus offsetting any potential gains in lipophilicity. In contrast, pyrrolotriazine A.20 showed dramatic improvements in permeability and efflux ratio, which can be attributed to the computed 0.7 pKBHX-unit decrease in the hydrogen-bond basicity of the aromatic nitrogen. The order-of-magnitude increase or decrease in hydrogen-bond-acceptor-strength induced by single-atom changes underscores the utility of prospective pKBHX prediction in silico.
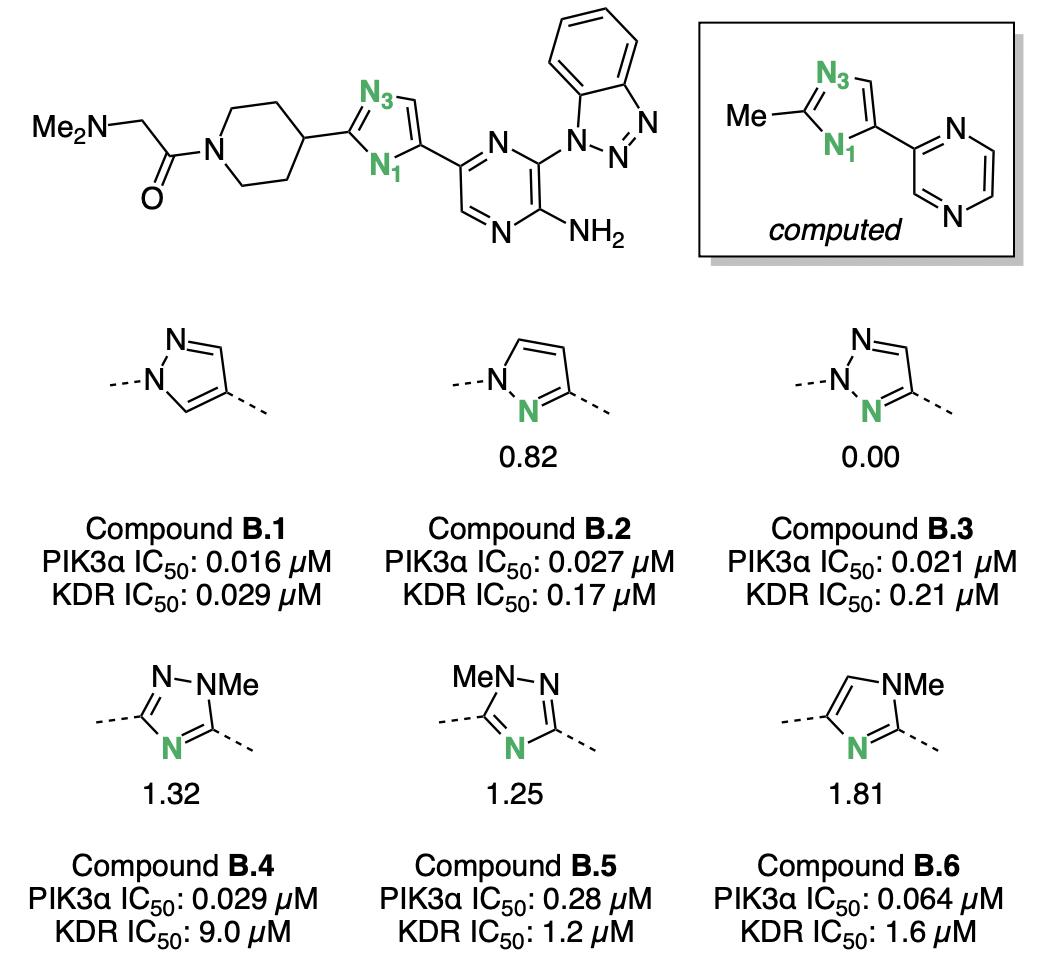
Figure 6: Pyrrolopyrimidine and pyrrolotriazole cores investigated by Degorce and co-workers. Basic nitrogens are labeled in green, with the corresponding pKBHX values computed by Rowan next to them. For experimental assay details, refer to Degorce et al.44
B: Designing PI3Kα-Selective Kinase Inhibitors
Bernard Barlaam and co-workers modified a kinase inhibitor (B.1) to achieve high selectivity for the PI3Kα kinase.45 Based on structural data, the authors hypothesized that introducing a nitrogen at "N1" (Figure 7) on the five-membered ring might induce lone-pair repulsion with several carbonyl groups found in other kinase binding pockets and thus lower the compound's affinity for these "anti-targets." A variety of azaarene linkers were tested against PI3Kα and the kinase anti-target KDR, and the addition of a nitrogen did indeed increase the selectivity for PI3Kα (Figure 7). Nitrogens that were better hydrogen-bond acceptors were found to be more selective: strong hydrogen-bond acceptors B.4 and B.6 bound to KDR with low potency, while weaker hydrogen-bond acceptors like B.2, B.3, and B.5 bound to KDR with high potency. Ultimately, triazole B.4 best balanced potency against PI3Kα with inter-kinase selectivity and was selected for further optimization.
Computed hydrogen-bond-acceptor strengths correlate well with the observed KDR activity: azaarenes with N1 pKBHX values greater than 1 have KDR IC50 values above 1 μM, while azaarenes with N1 pKBHX below 1 have have KDR IC50 values in the high nanomolar regime. If further scaffold exploration was necessary, computed pKBHX values could be used to rapidly screen out compounds that were likely to competitively inhibit KDR.
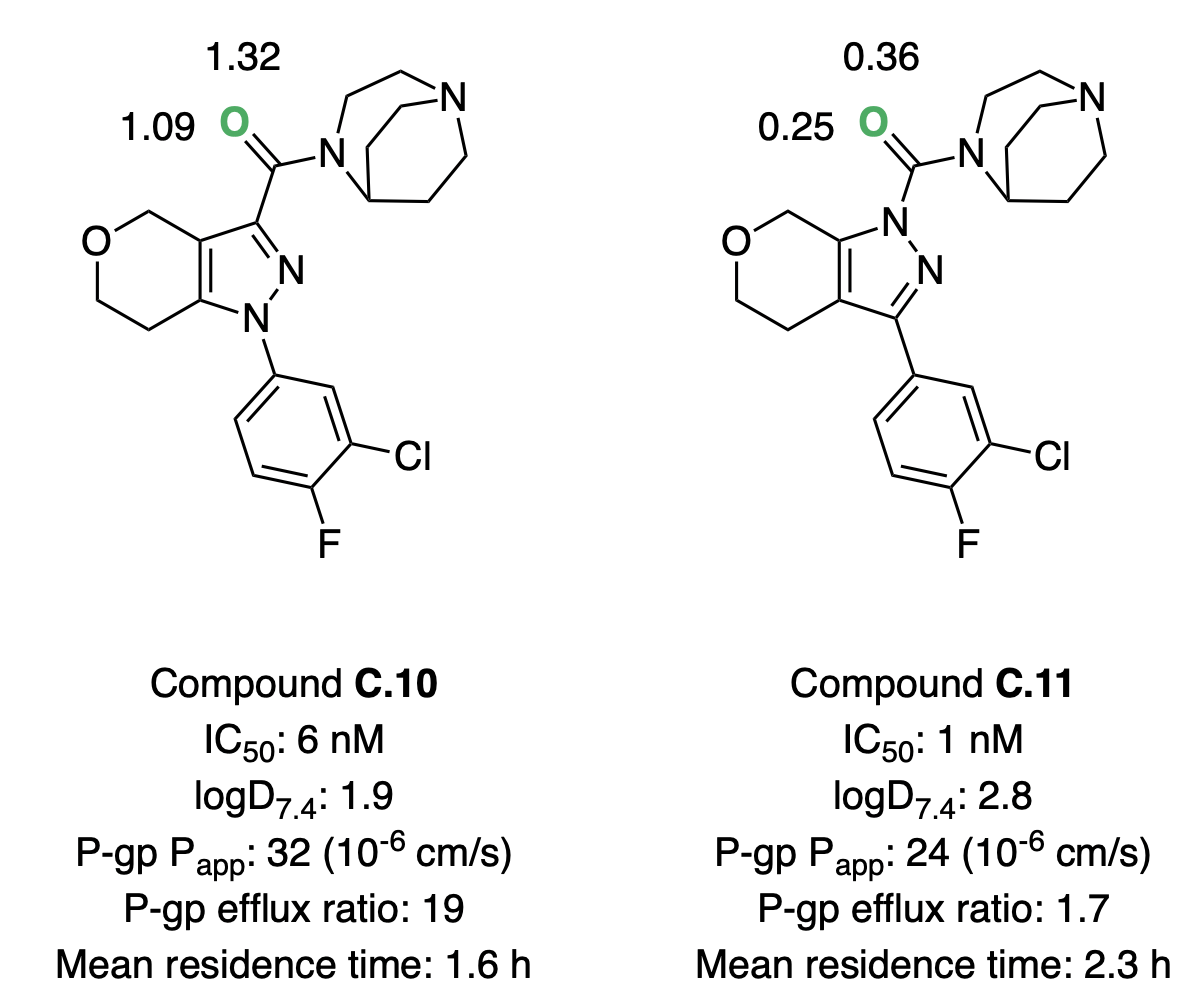
Figure 7: Kinase inhibitors investigated by Barlaam and co-workers.45 Basic nitrogens are labeled in green, with the corresponding pKBHX values computed by Rowan next to them. Hydrogen-bond-acceptor-strength calculations were run on the abbreviated structure shown in the box. For experimental assay details, refer to Barlaam et al.45
C: P-gp Transport In Glycosylceramide Synthase Inhibitors
Andreas Roecker and co-workers investigated a series of pyrazole-based compounds as glucosylceramide synthase inhibitors, with the goal of identifying a CNS-penetrant compound capable of reducing glycosphingolipid accumulation often seen in Parkinson's disease.46 High-throughput screening and direct-to-biology screening of c. 1300 compounds resulted in a highly potent lead compound that suffered from high P-gp transport. Performing a scaffold modification to replace a pyrazolyl amide (C.10) with a pyrazolyl urea (C.11) dramatically decreased efflux and extended the residence time in rat studies. Further optimization efforts around the pyrazolyl urea scaffold resulted in the development of several candidates suitable for in vivo testing.
Hydrogen-bond-basicity calculations can be used to rationalize these effects (Figure 8). Switching from amide to urea reduces the hydrogen-bond basicity of the key carbonyl group by approximately an order of magnitude, consistent with the decreased efflux and increased lipophilicity observed. Strong correlations between P-gp efflux and hydrogen-bond basicity have been reported previously in the literature.5,47
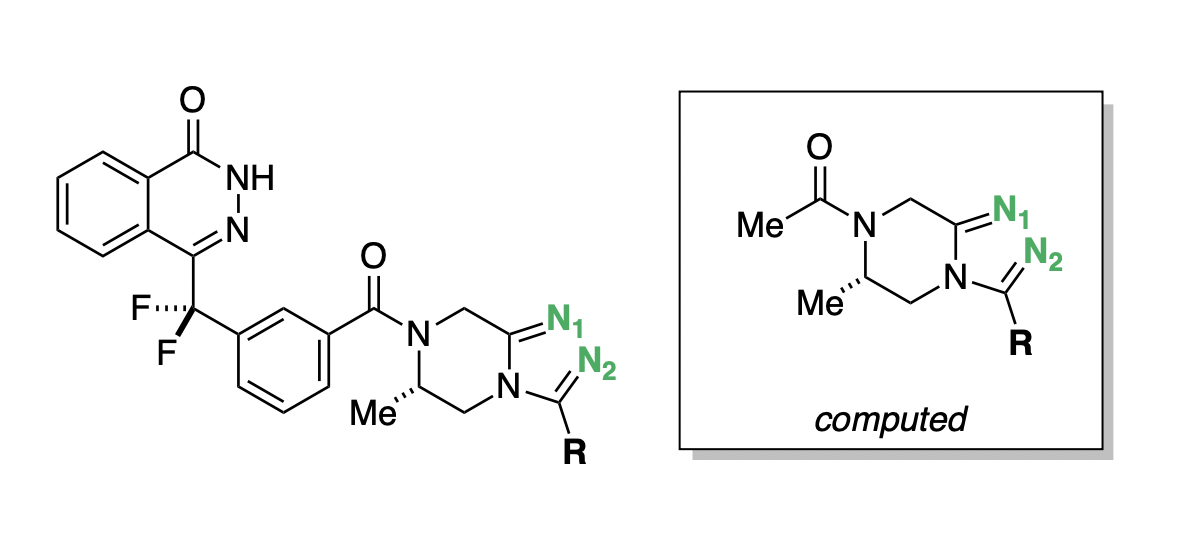
Figure 8: Glycocosylceramide synthase inhibitors investigated by Roecker and co-workers.46 The basic oxygen is labeled in green, with the corresponding pKBHX values computed by Rowan nearby. For experimental assay details, refer to Roecker et al.46
D: Managing Efflux In Oral PARP Inhibitors
In the process of developing poly-ADP ribose polymerase (PARP) inhibitors as potential anti-cancer agents,48 Chungang Gu and co-workers studied how modulating the strength of hydrogen-bond acceptors could be used to optimize the bioavailability of PARP inhibitors.49 They found that tuning the electronic properties of a key triazole ring was able to simultaneously modulate binding affinity, permeability, and efflux ratio (Figure 9). Compound D.15 maintained potency while dramatically increasing permeability and decreasing efflux (Table 2), and was selected for further in vivo studies.48
pKBHX predictions can be used to interpret these experimental results. Compound D.1, the strongest hydrogen-bond acceptor, has pKBHX values of and on the two triazole nitrogens (Table 2). Adding additional fluorines to the compound reduces the basicity of the triazole nitrogens, which makes the compound more permeable and less susceptible to efflux—compound D.15, which has a difluoroethyl group, preserves the activity of the parent compound while dramatically improving its biophysical properties. Surprisingly, moving from difluoroethyl to trifluoromethyl causes a fourfold decrease in EC50, a decrease in permeability, and an increase in efflux ratio (Table 2), contrary in all three cases to what simple trends based on pKBHX would predict. Activity cliffs like this are not uncommon in chemical structure–activity relationships, illustrating the limitations in using any single descriptor to predict compound performance.

Figure 9: General scaffold of the PARP inhibitors investigated by Gu and co-workers.49 Key basic nitrogens are labeled in green. Hydrogen-bond-acceptor-strength calculations were run on the abbreviated structure shown in the box.
| Compound | R | EC50 (µM) | Papp(A→B) (10-6 cm/s) | Efflux Ratio | pKBHX N1 | pKBHX N2 |
|---|---|---|---|---|---|---|
| D.1 | C(H)Me2 | 0.052 | 2.0(1.5) | 44(37) | 2.38 | 2.47 |
| D.14 | C(F)Me2 | 0.043 | 5.9(2.4) | 7(3.0) | 1.90 | 2.07 |
| D.15 | C(Me)F2 | 0.053 | 15.6(2.7) | 2(0.8) | 1.48 | 1.71 |
| D.12 | CF3 | 0.216 | 6.7(2.4) | 6(2.3) | 1.40 | 1.55 |
Table 2: Summary of R-groups, (), permeability (), efflux ratio, and pKBHX values. For experimental assay details, refer to Gu et al.49
E: Predicting Hydrogen-Bond-Donor Strength in Organocatalysts
In 2014, Walvoord and co-workers used a colorimetric molecular sensor to assay the strength of various hydrogen-bond-donor catalysts. They were able to measure binding free energy values for a variety of catalysts and demonstrated that these hydrogen-bond-donor-strength measurements correlated with observed rate acceleration in Diels–Alder reactions.50
We used the Walvoord dataset to test the ability of our computational hydrogen-bond-acidity workflow to reproduce hydrogen-bond-donor-strength values recorded under different experimental conditions. To simplify comparisons and eliminate the need to consider cooperative binding, we restricted the set of compounds studied to those containing only a single active hydrogen-bond donor. The predicted hydrogen-bond-acidity values showed excellent correlation with experimental binding free energies across a set of 16 compounds (Pearson correlation of 0.93) suggesting that the electrostatic-potential-based method employed here can be used as a generalizable probe of hydrogen-bond-donor strength (Figure 10).
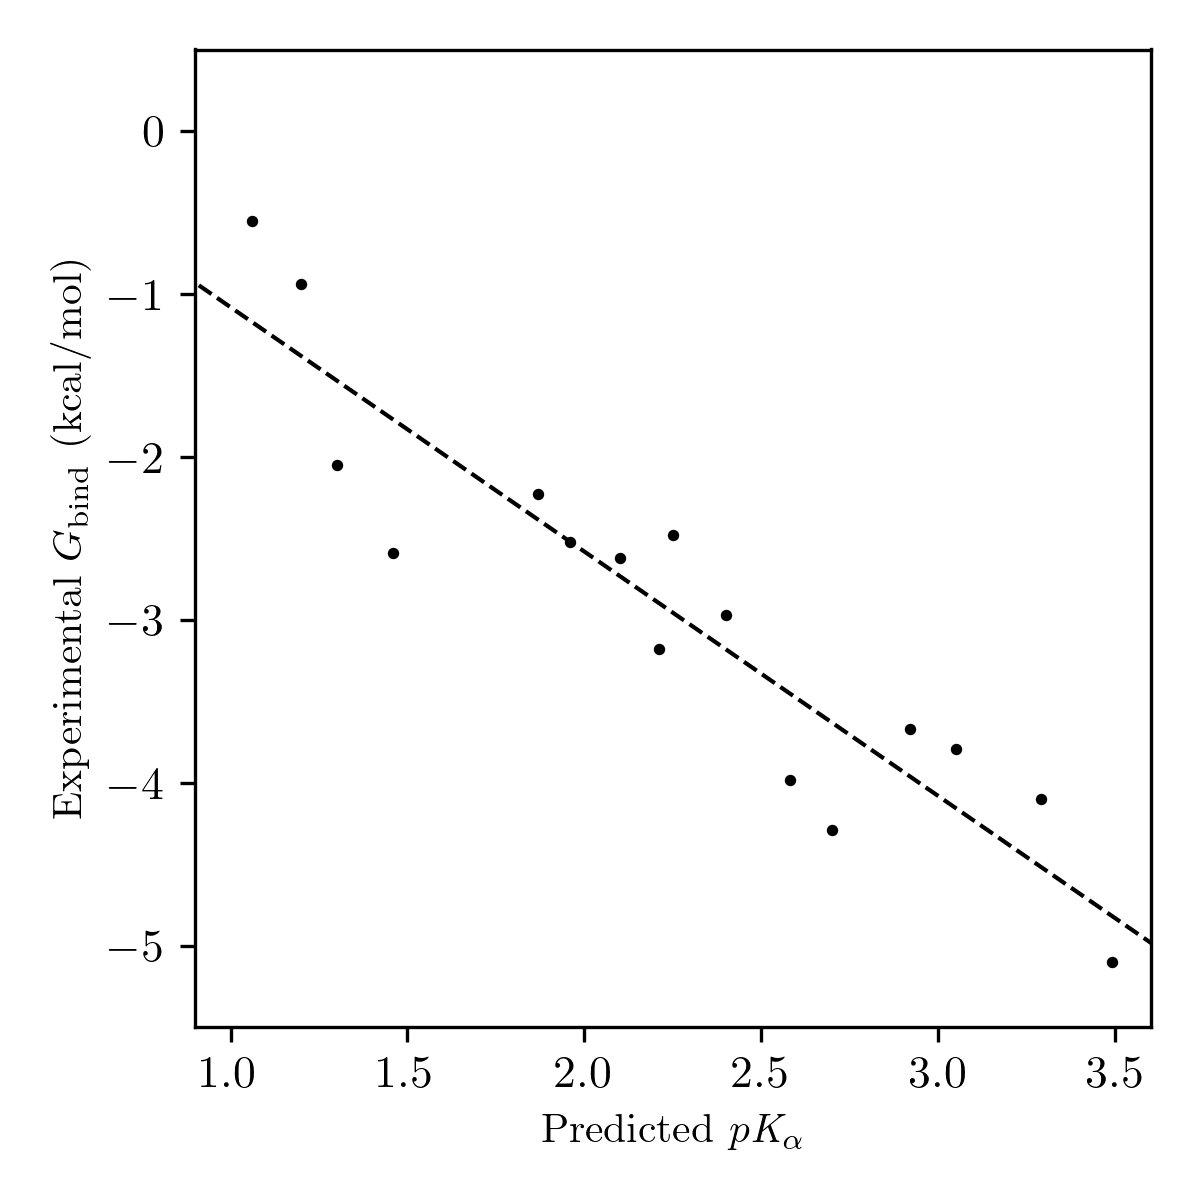
Figure 10: Plot of predicted pKα values and experimental binding free energies for neutral single hydrogen-bond-donor compounds from Walvoord's 2014 database.50 The dotted line indicates the line of best fit.
Conclusion
Improved scientific tools are a key driver of scientific progress.51 While computational methods for prediction of hydrogen-bond-acceptor strength were first reported over three decades ago,13 the broader utilization of these tools has been impeded by the lack of a workflow usable by non-computational scientists. Here, we address this lacuna through the development of a robust and efficient algorithm for pKBHX prediction. Our hydrogen-bond-basicity-prediction workflow predicts per-site pKBHX values directly from 2D- or 3D-representations of molecules, with no additional input required, and provides insight into otherwise opaque structural features of lead molecules, as illustrated by examples from the medicinal chemistry literature. We anticipate that this approach will be a valuable addition to the armamentarium of tools available to the modern drug hunter, and hope that this software can be more closely integrated into lead optimization programs in the future.
Acknowledgement
C.C.W. thanks Gilles Ouvry for initial discussions on this topic & for suggesting the papers discussed in case studies B and D, Ari Wagen for designing and implementing the visuals shown in Figures 2 & 4, and Ari Wagen, Jonathon Vandezande, Eugene Kwan, Hayden Sharma, Marcus Sak, Jonathan Wong, Lewis Martin, Gilles Ouvry, Harry Stern, Michael Nielsen, & an anonymous industry scientist for feedback on drafts of this manuscript.
References
- Doyle, A. G.; Jacobsen, E. N. Small-Molecule H-Bond Donors in Asymmetric Catalysis. Chem. Rev. 2007, 107, 5713–5743.
- Bissantz, C.; Kuhn, B.; Stahl, M. A Medicinal Chemist's Guide to Molecular Interactions. J. Med. Chem. 2010, 53, 5061–5084.
- Kenny, P. W. Hydrogen-Bond Donors in Drug Design. J. Med. Chem. 2022, 65, 14261–14275.
- Toulmin, A.; Wood, J. M.; Kenny, P. W. Toward Prediction of Alkane/Water Partition Coefficients. J. Med. Chem. 2008, 51, 3720–3730.
- Desai, P. V.; Raub, T. J.; Blanco, M.-J. How hydrogen bonds impact P-glycoprotein transport and permeability. Bioorg. Med. Chem. Lett. 2012, 22, 6540–6548.
- Kenny, P. W.; Montanari, C. A.; Prokopczyk, I. M.; Ribeiro, J. F. R.; Sartori, G. R. Hydrogen Bond Basicity Prediction for Medicinal Chemistry Design. J. Med. Chem. 2016, 59, 4278–4288.
- Borges, N. M.; Kenny, P. W.; Montanari, C. A.; Prokopczyk, I. M.; Ribeiro, J. F. R.; Rocha, J. R.; Sartori, G. R. The influence of hydrogen bonding on partition coefficients. J. Comput. Aided Mol. Des. 2017, 31, 163–181.
- Laurence, C.; Berthelot, M. Observations on the strength of hydrogen bonding. Perspect. Drug Discovery Des. 2000, 18, 39–60
- Gurka, D.; Taft, R. W. Studies of hydrogen-bonded complex formation with p-fluorophenol. IV. Fluorine nuclear magnetic resonance method. J. Am. Chem. Soc. 1969,91, 4794–4801.
- Taft, R. W.; Gurka, D.; Joris, L.; Schleyer, P. v. R.; Rakshys, J. W. Studies of hydrogen-bonded complex formation with p-fluorophenol. V. Linear free energy relationships with OH reference acids. J. Am. Chem. Soc. 1969, 91, 4801–4808.
- Laurence, C.; Brameld, K. A.; Graton, J.; Le Questel, J.-Y.; Renault, E. The pKBHX Database: Toward a Better Understanding of Hydrogen-Bond Basicity for Medicinal Chemists. J. Med. Chem. 2009, 52, 4073–4086.
- Kenny, P. W. Hydrogen bond basicity data: text file with measured pKBHX val- ues, isomeric SMILES strings and literature references. https://figshare.com/articles/dataset/Hydrogen_bond_basicity_data_text_file_with_measured_pKBHX_values_isomeric_SMILES_strings_and_literature_references/12084183, 2020; [Accessed 17-01-2025].
- Kenny, P. W. Prediction of hydrogen bond basicity from computed molecular electrostatic properties. J. Chem. Soc., Perkin Trans. 2 1994, 199–202.
- Le Questel, J.-Y.; Berthelot, M.; Laurence, C. Can semi-empirical calculations yield reasonable estimates of hydrogen-bonding basicity? The case of nitriles. J. Chem. Soc., Perkin Trans. 2 1997, 2711–2718.
- Platts, J. A. Theoretical prediction of hydrogen bond basicity. Phys. Chem. Chem. Phys. 2000, 2, 3115–3120.
- Gancia, E.; Montana, J. G.; Manallack, D. T. Theoretical hydrogen bonding parameters for drug design. J. Mol. Graph. Model. 2001, 19, 349–362.
- Lamarche, O.; Platts, J. A. Theoretical Prediction of the Hydrogen-Bond Basicity pKHB. Chem. Eur. J. 2002, 8, 457–466.
- Besseau, F.; Graton, J.; Berthelot, M. A Theoretical Evaluation of the pKHB and ΔH°HB Hydrogen-Bond Scales of Nitrogen Bases. Chem. Eur. J. 2008, 14, 10656–10669.
- Devereux, M.; Popelier, P. L. A.; McLay, I. M. A refined model for prediction of hydrogen bond acidity and basicity parameters from quantum chemical molecular descriptors. Phys. Chem. Chem. Phys. 2009, 11, 1595–1603.
- Green, A. J.; Popelier, P. L. A. Theoretical Prediction of Hydrogen-Bond Basicity pKBHX Using Quantum Chemical Topology Descriptors. J. Chem. Inf. Model. 2014, 54, 553–561.
- Bauer, C. A.; Schneider, G.; Göller, A. H. Machine learning models for hydrogen bond donor and acceptor strengths using large and diverse training data generated by first-principles interaction free energies. J. Cheminform. 2019,11, 59.
- Hagelin, H.; Murray, J. S.; Politzer, P.; Brinck, T.; Berthelot, M. Family-independent relationships between computed molecular surface quantities and solute hydrogen bond acidity/basicity. Can. J. Chem. 1995, 73, 483–488.
- Kenny, P. W. Hydrogen Bonding, Electrostatic Potential, and Molecular Design. J. Chem. Inf. Model. 2009, 49, 1234–1244.
- Grimme, S.; Hansen, A.; Ehlert, S.; Mewes, J.-M. r²SCAN-3c: A "Swiss army knife" composite electronic-structure method. J. Chem. Phys. 2021, 154, 064103.
- Wagen, C. C.; Wagen, A. M.; Mann, E. L.; Vandezande, J. E.; Schneider, S. C. Rowan. https://www.rowansci.com, 2023–2025.
- Riniker, S.; Landrum, G. A. Better Informed Distance Geometry: Using What We Know To Improve Conformation Generation. J. Chem. Inf. Model. 2015, 55, 2562–2574.
- Wang, S.; Witek, J.; Landrum, G. A.; Riniker, S. Improving Conformer Generation for Small Rings and Macrocycles Based on Distance Geometry and Experimental Torsional- Angle Preferences. J. Chem. Inf. Model. 2020, 60, 2044–2058.
- RDKit: Open-source cheminformatics. https://www.rdkit.org. https://www.rdkit.org, 2013–2025.
- Halgren, T. A. Merck molecular force field. I. Basis, form, scope, parameterization, and performance of MMFF94. J. Comp. Chem. 1996, 17, 490–519.
- Pracht, P.; Bohle, F.; Grimme, S. Automated exploration of the low-energy chemical space with fast quantum chemical methods. Phys. Chem. Chem. Phys. 2020, 22, 7169–7192.
- Pracht, P.; Grimme, S.; Bannwarth, C.; Bohle, F.; Ehlert, S.; Feldmann, G.; Gorges, J.; Müller, M.; Neudecker, T.; Plett, C.; Spicher, S.; Steinbach, P.; Weso lowski, P. A.; Zeller, F. CREST—A program for the exploration of low-energy molecular chemical space. J. Chem. Phys. 2024, 160, 114110.
- Anstine, D.; Zubatyuk, R.; Isayev, O. AIMNet2: A Neural Network Potential to Meet your Neutral, Charged, Organic, and Elemental-Organic Needs. ChemRxiv 2024.
- Turney, J. M. et al. Psi4: an open-source ab initio electronic structure program. Wiley Interdiscip. Rev.:Comput. Mol. Sci.2012, 2, 556–565.
- Virtanen, P. et al. SciPy 1.0: fundamental algorithms for scientific computing in Python. Nat. Methods 2020, 17, 261–272.
- Stratmann, R.; Scuseria, G. E.; Frisch, M. J. Achieving linear scaling in exchange-correlation density functional quadratures. Chemical Physics Letter 1996, 257, 213–223.
- Gray, M.; Bowling, P. E.; Herbert, J. M. Comment on "Benchmarking Basis Sets for Density Functional Theory Thermochemistry Calculations: Why Unpolarized Basis Sets and the Polarized 6-311G Family Should Be Avoided". J. Phys. Chem. A 2024, 128, 7739–7745.
- Saunders, V. R.; Hillier, I. H. A "Level-Shifting" method for converging closed shell Hartree–Fock wave functions. Int. J. Quantum Chem., 1973, 7, 699–705.
- Wang, L.-P.; Song, C. Geometry optimization made simple with translation and rotation coordinates. J. Chem. Phys. 2016, 144, 214108.
- Levenberg, K. A method for the solution fo certain non-liner problems in least squares. Q. Appl. Math. 1944, 2, 164–168.
- Marquardt, D. W. An Algorithm for Least-Squares Estimation of Nonlinear Parameters. J. Soc. Ind. Appl. Math. 1963, 11, 431–441.
- Newville, M. et al. lmfit/lmfit.py 1.3.2. 2024; https://doi.org/10.5281/zenodo.12785036.
- Graton, J.; Le Questel, J.-Y.; Maxwell, P.; Popelier, P. Hydrogen-Bond Accepting Properties of New Heteroaromatic Ring Chemical Motifs: A Theoretical Study. J. Chem. Inf. Model. 2016, 56, 322–334.
- Di, L.; Kerns, E. H. Drug-Like Properties: Concepts, Structure Design and Methods, 2nd ed.; Academic Press: Boston, 2016.
- Degorce, S. L.; Anjum, R.; Dillman, K. S.; Drew, L.; Groombridge, S. D.; Halsall, C. T.; Lenz, E. M.; Lindsay, N. A.; Mayo, M. F.; Pink, J. H.; Robb, G. R.; Scott, J. S.; Stokes, S.; Xue, Y. Optimization of permeability in a series of pyrrolotriazine inhibitors of IRAK4. Bioorg. Med. Chem. 2018, 26, 913–924.
- Barlaam, B.; Cosulich, S.; Fitzek, M.; Green, S.; Harris, C. S.; Hudson, K.; Lambert- van der Brempt, C.; Ouvry, G.; Page, K.; Ruston, L.; Ward, L.; Delouvrié, B. Design of selective PI3Kα inhibitors starting from a promiscuous pan kinase scaffold. Bioorg. Med. Chem. Lett. 2015, 25, 2679–2685.
- Roecker, A. J. et al. Pyrazole Ureas as Low Dose, CNS Penetrant Glucosylceramide Synthase Inhibitors for the Treatment of Parkinson's Disease. ACS Med. Chem. Lett. 2023, 14, 146–155.
- Schnider, P. et al. Discovery of Balovaptan, a Vasopressin 1a Receptor Antagonist for the Treatment of Autism Spectrum Disorder. J. Med. Chem. 2020,63, 1511–1525.
- Johannes, J. W. et al. Discovery of AZ0108, an orally bioavailable phthalazinone PARP inhibitor that blocks centrosome clustering. Bioorg. Med. Chem. Lett. 2015, 25, 5743–5747.
- Gu, C. et al. Modulating the strength of hydrogen bond acceptors to achieve low Caco2 efflux for oral bioavailability of PARP inhibitors blocking centrosome clustering. Bioorg. Med. Chem. Lett. 2016, 26, 4775–4780.
- Walvoord, R. R.; Huynh, P. N.; Kozlowski, M. C. Quantification of electrophilic activation by hydrogen-bonding organocatalysts. Journal of the American Chemical Society 2014,136, 16055–16065
- Dyson, F. J. Is Science Mostly Driven by Ideas or by Tools? Science 2012, 338, 1426–1427.